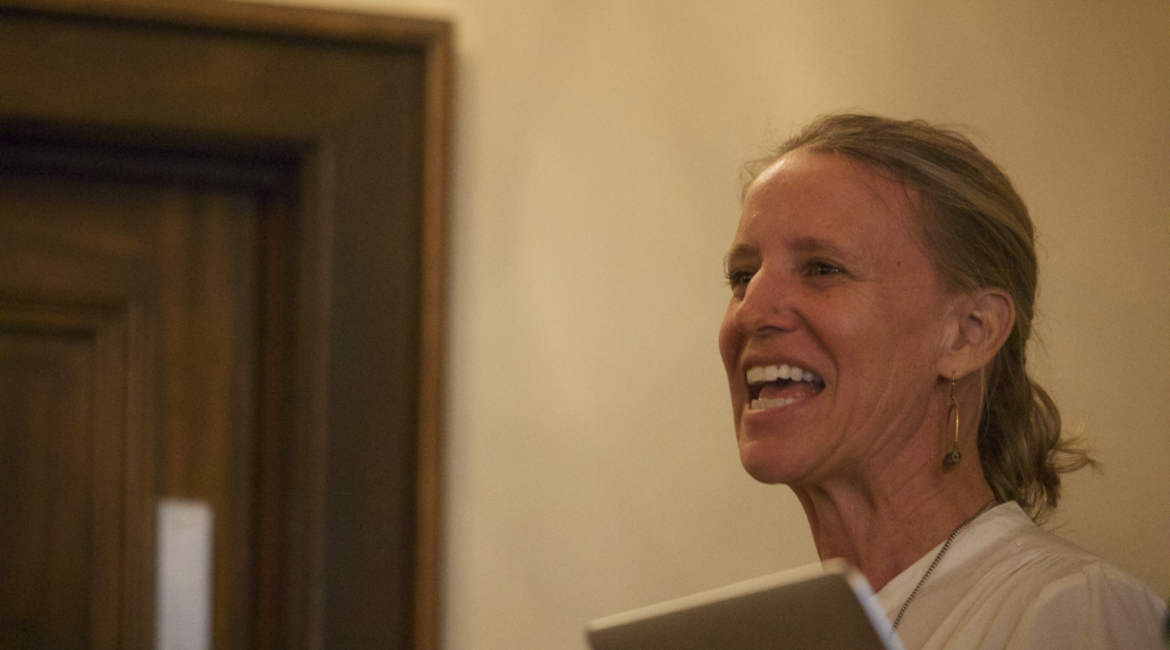
As part of our spring 2017 Speaker Series, the Digital Writing & Research Lab hosted Dr. Laurie Gries, whose lecture “Doing Digital Visual Studies” reflects upon and extends the research she undertook in her award-winning book Still Life with Rhetoric: A New Materialist Approach for Visual Rhetorics. In her longitudinal study of Shepard Fairey’s “Obama Hope,” she developed a digital, visual methodology called iconographic tracking in order “to trace the circulation, transformation, and consequentiality of new media images.”
Dr. Gries’s talk emphasizes the current challenges facing scholars who do visual research with new media images: “As a visual methodologist, I am especially concerned that our ways of doing visual studies have not kept pace with the proliferation of digitally mediated practices and the digital technologies at our disposal to study them.”
Considering the time and energy that it takes keep pace with these practices and technologies, Dr. Gries poses the provocative question: “Is it worth our efforts to use digital visualization to try to expand our knowledge?”
Her answer is encouraging: “There actually is a lot we can learn from using data visualization if we put them to work during our research process.” She outlines four reasons why we should continue to engage in these efforts.
- “Digital Visualization techniques are useful for extending datasets and deepening our knowledge of an image’s rhetorical impact, especially when a viral image’s story involves transnational circulation.”
- “Data Visualization techniques can help generate quantifiable evidence to substantiate new claims, and either confirm or revise past claims based on qualitative research.”
- “Data Visualization techniques can help us identify and give name to phenomena that become visible during our visualizations.”
- “Digital Visualization techniques can help us develop new modes of analysis that are needed to make sense of the growing amount of visual data that confronts us on a daily basis.”
In addition to her advocacy of data visualization techniques, Dr. Gries also considers how a renewed commitment to visual studies likewise commits us to the development of digital technologies that align with our methodologies and objects of study: “As visual rhetoricians increasingly begin to find ourselves in a digital humanities situation—a situation in which we realize that digital technologies can play a crucial and transformative role in our interpretive process, we must also begin to invest our time and energy into building software that can expedite our research process.”
Noting the variety of digital tools that she had pieced together in her research—from Google Images, TinEye, Zotero, Google Fusion Tables to Google Maps, Voyant Tools, CARTO—Dr. Gries observes that “no single software program exists to conduct iconographic tracking, which entails a recursive process of data collection, data mining, and data analysis.” As a result, she argues, “Such piece-mealing makes iconographic tracking extremely time intensive and unnecessarily laborious. And it limits the amount of visual data that researchers can ultimately collect and analyze given typical research time constraints.”
In her own efforts to develop the software program PikTrack to resolve these issues, Dr. Gries asks the difficult questions that scholars who produce software for research must ask themsleves: “Do I want to be responsible for maintaining it? For troubleshooting when others encounter glitches? For enhancing its needs as new research needs arise?”
Additionally, she asks, “As we think about the future directions of writing studies, should we even be devoting our time to such software development? . . . Is such scholarly work worth our time and effort?”
Ultimately, Dr. Gries concludes that it is worth it: “Doing visual studies in the digital age, in my eyes, means being able to embrace experimentation, and to take on risks to invent visual methods to help us confront our current research needs. As we begin to adjust to new orders of magnitude and work with larger datasets related to visual and media production, we especially need to be proactive in designing the methods and tools that can diversify our research practices so that our visual methodologies keep pace with our contemporary objects of study.”
Feature Image: “Dr. Laurie Gries” by Amy Tuttle.


