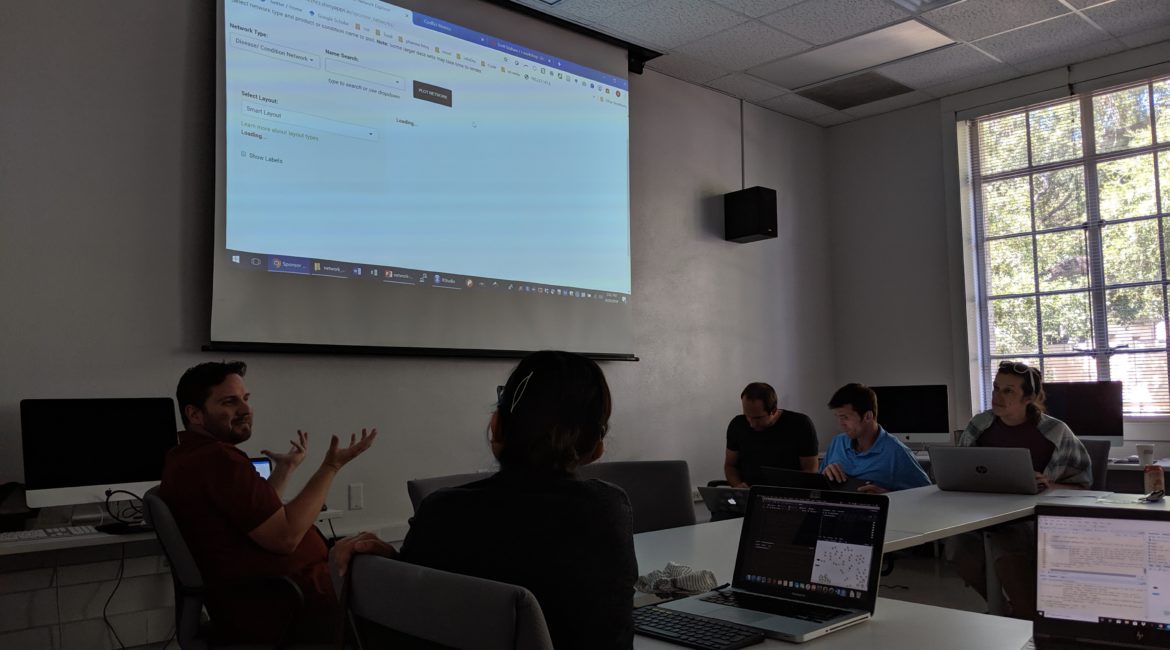
For week three of skills workshops, Dr. Scott Graham, Assistant Professor in the Department of Rhetoric and Writing at the University of Texas at Austin, guided DWRL students through the concept of Network Modeling in R. The workshop began by defining and outlining what a network represents and how a network model can be useful in visualizing relationships. Broadly defined, a network model is used to represent a set of nodes, or object types, and articulations or edges, between them which serve to symbolize the relationships between nodes. Furthermore, the number and thickness of articulations coming out of nodes allows for visualization capabilities that represent relative strength in relationships.
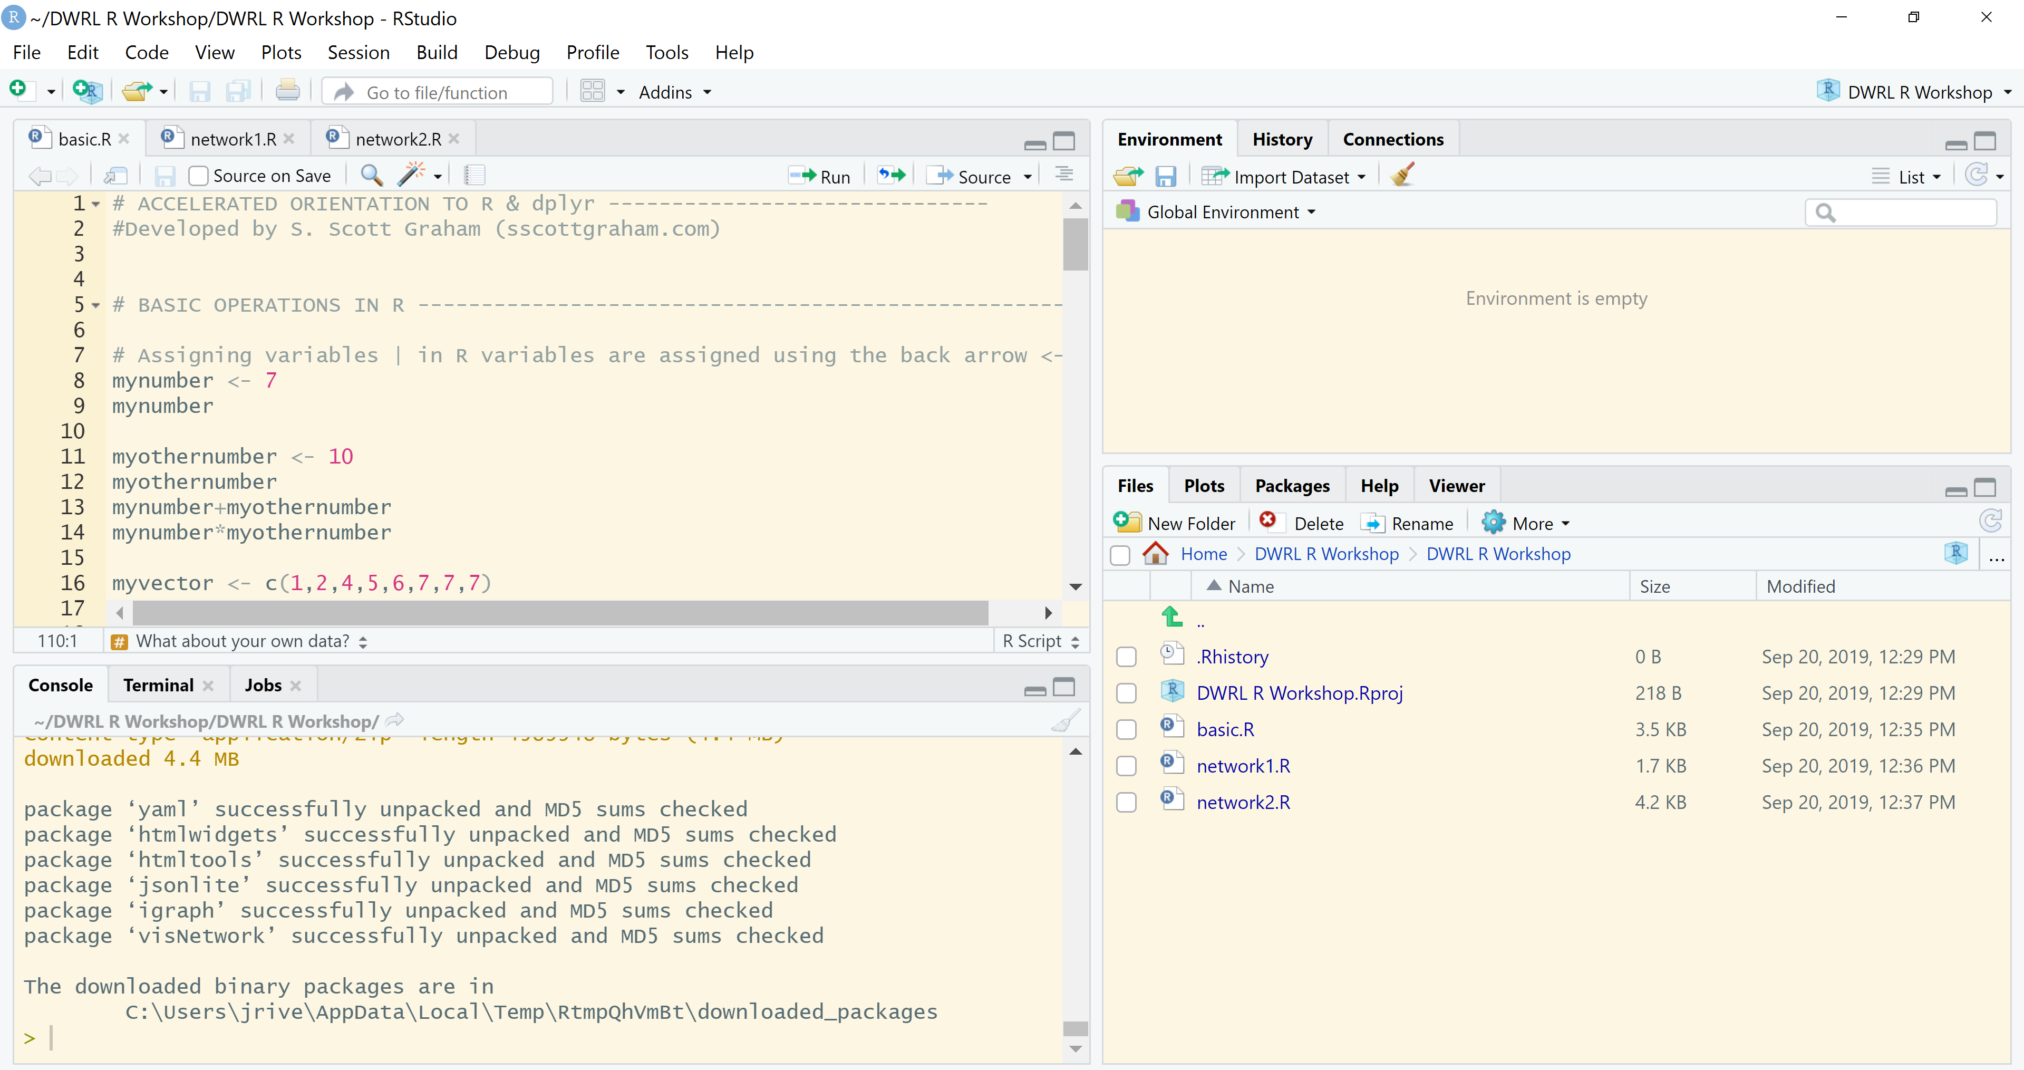
After a brief demonstration of how a network model can be useful in representing a set of relationships, we moved on to discuss the pros and cons attributed to the R software and programming language in constructing our network model through visualization on RStudio, an open-source software which provides analysis tools for R. Using R as a medium allows for a balance to be made between an aesthetically pleasing layout and useful interactivity at a low cost. Additionally, the programming language of R allows for multiple network models to be run at a time, increasing the scaling capabilities.
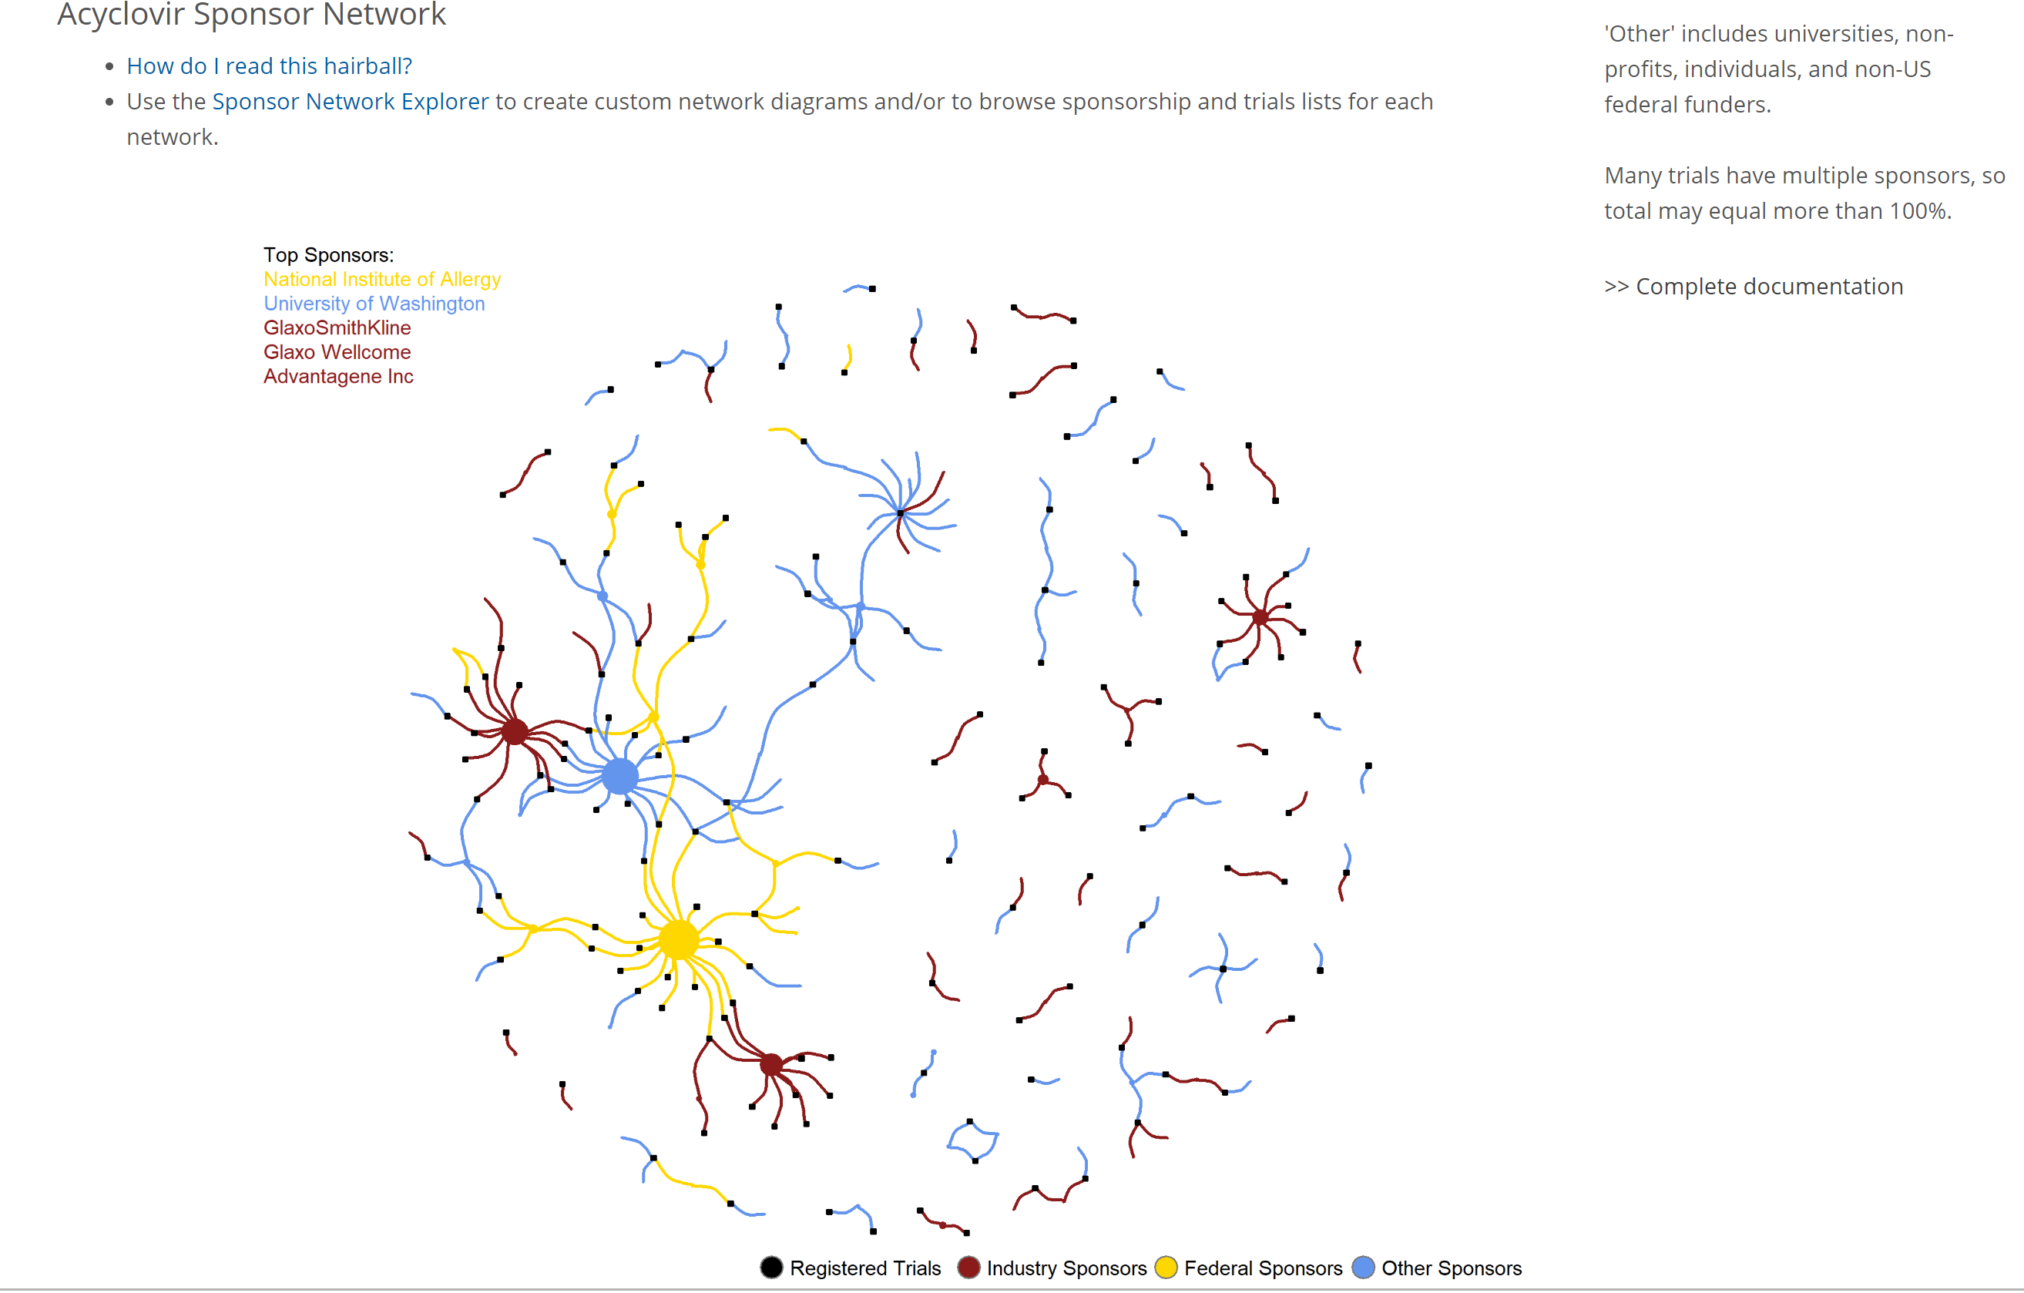
While other applications for visualizing networks exist, many require nodes and edges to be formatted in ways that can prove to be laborious, particularly if running multiple models. Through the use of packages in R for network analysis, data can be refined from messy lists into meaningful sets of nodes and edges. Using Dr. Scott Graham’s work in developing and curating network models for visualizing biomedical research sponsorships, we were able to assess the benefits associated with network modeling in R.
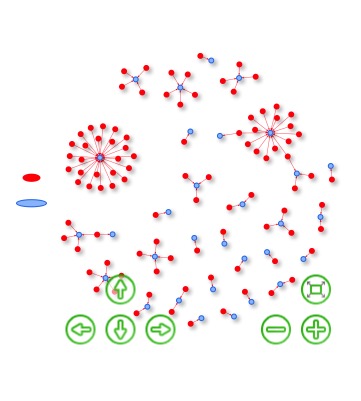
Finally, using various data sets from Twitter hashtags to US Department of Transportation donors, we analyzed network data and practiced adjusting layouts to familiarize ourselves with the potentials of visualization through network modeling in R.