[cs_content][cs_section parallax=”false” style=”margin: 0px;padding: 50px 0px 10px;”][cs_row inner_container=”true” marginless_columns=”false” style=”margin: 0px auto;padding: 0px;”][cs_column fade=”false” fade_animation=”in” fade_animation_offset=”45px” fade_duration=”750″ type=”1/1″ style=”padding: 0px;”][x_image type=”none” src=”https://www.dwrl.utexas.edu/wp-content/uploads/2016/10/Mindmup4m.png” alt=”A MindMup screenshot in which clusters of ideas are color-coded to demonstrate similar themes” link=”false” href=”#” title=”” target=”” info=”none” info_place=”top” info_trigger=”hover” info_content=””][/cs_column][/cs_row][/cs_section][cs_section bg_color=”hsl(0, 0%, 100%)” parallax=”false” class=”cs-ta-left” style=”margin: 0px;padding: 45px 0px;”][cs_row inner_container=”true” marginless_columns=”false” style=”margin: 0px auto;padding: 0px;”][cs_column fade=”false” fade_animation=”in” fade_animation_offset=”45px” fade_duration=”750″ type=”2/3″ style=”padding: 0px;”][cs_text]Typically, when we think about data visualization, we think about a product–an infographic or chart that helps viewers understand and engage with complex information. Today, we’re doing something a little different and thinking about visualization as a tool for students to identify relationships and patterns in their research.
We’ll start by introducing MindMup, a digital mindmapping tool, and present a basic how-to for its use. We are then going to use MindMup as a way to uncover relationships. Usually, mindmaps are used for brainstorming–to move outward from a central concept to a handful of concept types to many and specific concept manifestations. Here, we are going to do the opposite and use mindmaps to move inward from many, specific pieces of information to pattern and group identification, and then to a central, general concept. We will then talk about how a mind map can work to outline an argument or potential research question. [/cs_text][x_custom_headline level=”h3″ looks_like=”h5″ accent=”false”]Learning Objectives[/x_custom_headline][cs_text]Teachers will be able to use this lesson plan to guide students from identifying patterns and relationships within a data set to constructing a thesis statement or research question.
Teachers will be able to use this lesson plan to introduce students to a valuable digital tool adaptable to a variety of projects and goals. [/cs_text][cs_icon_list][cs_icon_list_item title=”Critical Thinking” type=”check” link_enabled=”false” link_url=”#” link_new_tab=”false”]Critical Thinking[/cs_icon_list_item][cs_icon_list_item title=”Mindmapping” type=”check” link_enabled=”false” link_url=”#” link_new_tab=”false”]Mindmapping[/cs_icon_list_item][cs_icon_list_item title=”Data Visualization & Management” type=”check” link_enabled=”false” link_url=”#” link_new_tab=”false”]Data Visualization & Management[/cs_icon_list_item][/cs_icon_list][/cs_column][cs_column fade=”false” fade_animation=”in” fade_animation_offset=”45px” fade_duration=”750″ type=”1/3″ style=”padding: 0px 0px 0px 30px;”][x_feature_list][x_feature_box title=”Assignment Length” title_color=”” text_color=”” graphic=”icon” graphic_size=”40px” graphic_shape=”circle” graphic_color=”#ffffff” graphic_bg_color=”rgb(140, 140, 140)” align_h=”left” align_v=”top” side_graphic_spacing=”10px” max_width=”200px” child=”true” connector_width=”1 px” connector_style=”dashed” connector_color=”#272727″ graphic_icon=”clock-o”]1-2 class days[/x_feature_box][x_feature_box title=”Required Materials” title_color=”” text_color=”” graphic=”icon” graphic_size=”40px” graphic_shape=”circle” graphic_color=”#ffffff” graphic_bg_color=”hsl(0, 0%, 56%)” align_h=”left” align_v=”top” side_graphic_spacing=”10px” max_width=”200px” child=”true” connector_width=”1 px” connector_style=”dashed” connector_color=”#272727″ graphic_icon=”cut”]Computer with Internet access. A data set is employed in this lesson plan as an example, but teachers might want to identify a different set or have students gather their own for independent practice.[/x_feature_box][x_feature_box title=”Skills Necessary” title_color=”” text_color=”” graphic=”icon” graphic_size=”40px” graphic_shape=”circle” graphic_color=”#ffffff” graphic_bg_color=”rgb(140, 140, 140)” align_h=”left” align_v=”top” side_graphic_spacing=”10px” max_width=”200px” child=”true” connector_width=”1 px” connector_style=”dashed” connector_color=”#272727″ graphic_icon=”download”]Basic computer skills[/x_feature_box][/x_feature_list][/cs_column][/cs_row][/cs_section][cs_section bg_color=”hsla(232, 20%, 65%, 0.3)” parallax=”false” style=”margin: 0px 0px 0px 60px;padding: 10px 0px 45px;”][cs_row inner_container=”true” marginless_columns=”false” style=”margin: 0px auto;padding: 0px;”][cs_column fade=”false” fade_animation=”in” fade_animation_offset=”45px” fade_duration=”750″ type=”1/1″ style=”padding: 0px;”][x_feature_headline level=”h2″ looks_like=”h3″ icon=”globe”]Access and Adaptability[/x_feature_headline][x_gap size=”30px”][cs_text]
This lesson employs a variety of media forms to fulfill diverse learning style needs and can be easily adapted for classrooms not based in computer labs. To incorporate this workshop into a standard classroom, you can use a computer and projector to work through its process as a group. This lesson plan can also be used as a guide for mindmapping without using MindMup or other technology; students can easily and reasonably replicate these methods with sticky notes and a tabletop or wall.
Steps in the Skills Workshop have been described through text with supplemental video. Video transcripts are available through YouTube.[/cs_text][/cs_column][/cs_row][/cs_section][cs_section parallax=”false” style=”margin: 0px;padding: 45px 0px;”][cs_row inner_container=”false” marginless_columns=”false” style=”margin: 0px auto;padding: 0px;”][cs_column fade=”false” fade_animation=”in” fade_animation_offset=”45px” fade_duration=”750″ type=”1/1″ class=”cs-ta-center” style=”padding: 0px;”][x_image type=”none” src=”https://www.dwrl.utexas.edu/wp-content/uploads/2016/10/mindmup-3.png” alt=”Example of min” link=”false” href=”#” title=”” target=”” info=”none” info_place=”top” info_trigger=”hover” info_content=””][/cs_column][/cs_row][/cs_section][cs_section bg_color=”hsla(291, 21%, 79%, 0.53)” parallax=”false” style=”margin: 0px 0px 0px 60px;padding: 10px 0px;”][cs_row inner_container=”true” marginless_columns=”false” style=”margin: 0px auto;padding: 0px;”][cs_column fade=”false” fade_animation=”in” fade_animation_offset=”45px” fade_duration=”750″ type=”1/1″ style=”padding: 0px;”][x_feature_headline level=”h2″ looks_like=”h3″ icon=”paperclip”]Assignment Suggestions
[/x_feature_headline][x_gap size=”30px”][cs_text]There are a few options for data sets here. If this workshop is part of a long-term unit on data gathering and sharing, you can have students use a data set they have gathered themselves or one they’ve identified as a personal point of interest. If this is a stand-alone presentation, it might be a good idea to provide them with a data set of reasonable size and scope. For more information on data sets, see this lesson plan. [/cs_text][/cs_column][/cs_row][/cs_section][cs_section bg_color=”rgb(250, 250, 250)” parallax=”false” style=”margin: 0px 0px 0px 60px;padding: 10px 0px 45px;”][cs_row inner_container=”true” marginless_columns=”false” style=”margin: 0px auto;padding: 0px;”][cs_column fade=”false” fade_animation=”in” fade_animation_offset=”45px” fade_duration=”750″ type=”1/1″ style=”padding: 0px;”][x_feature_headline level=”h2″ looks_like=”h3″ icon=”pencil”]Skills Workshop[/x_feature_headline][x_gap size=”30px”][x_button size=”global” block=”false” circle=”false” icon_only=”false” href=”#” title=”www.mindmup.com” target=”blank” info=”none” info_place=”top” info_trigger=”hover” info_content=””]Go to MindMup[/x_button][x_gap size=”30px”][cs_text]WHAT IS MINDMUP? MindMup is an online mindmapping tool that lets you create, save, and share digitally. It’s great because: you can embed links, images, excerpts, etc. so that all of your information is in one place; it lets you maneuver through layers of info and move/add pieces at will, which can be hard with pen and paper; it’s pretty infinitely large and you can zoom in or out for micro or macro perspectives; it can be used for group brainstorming and storyboarding, which we won’t talk about today but is good to know.
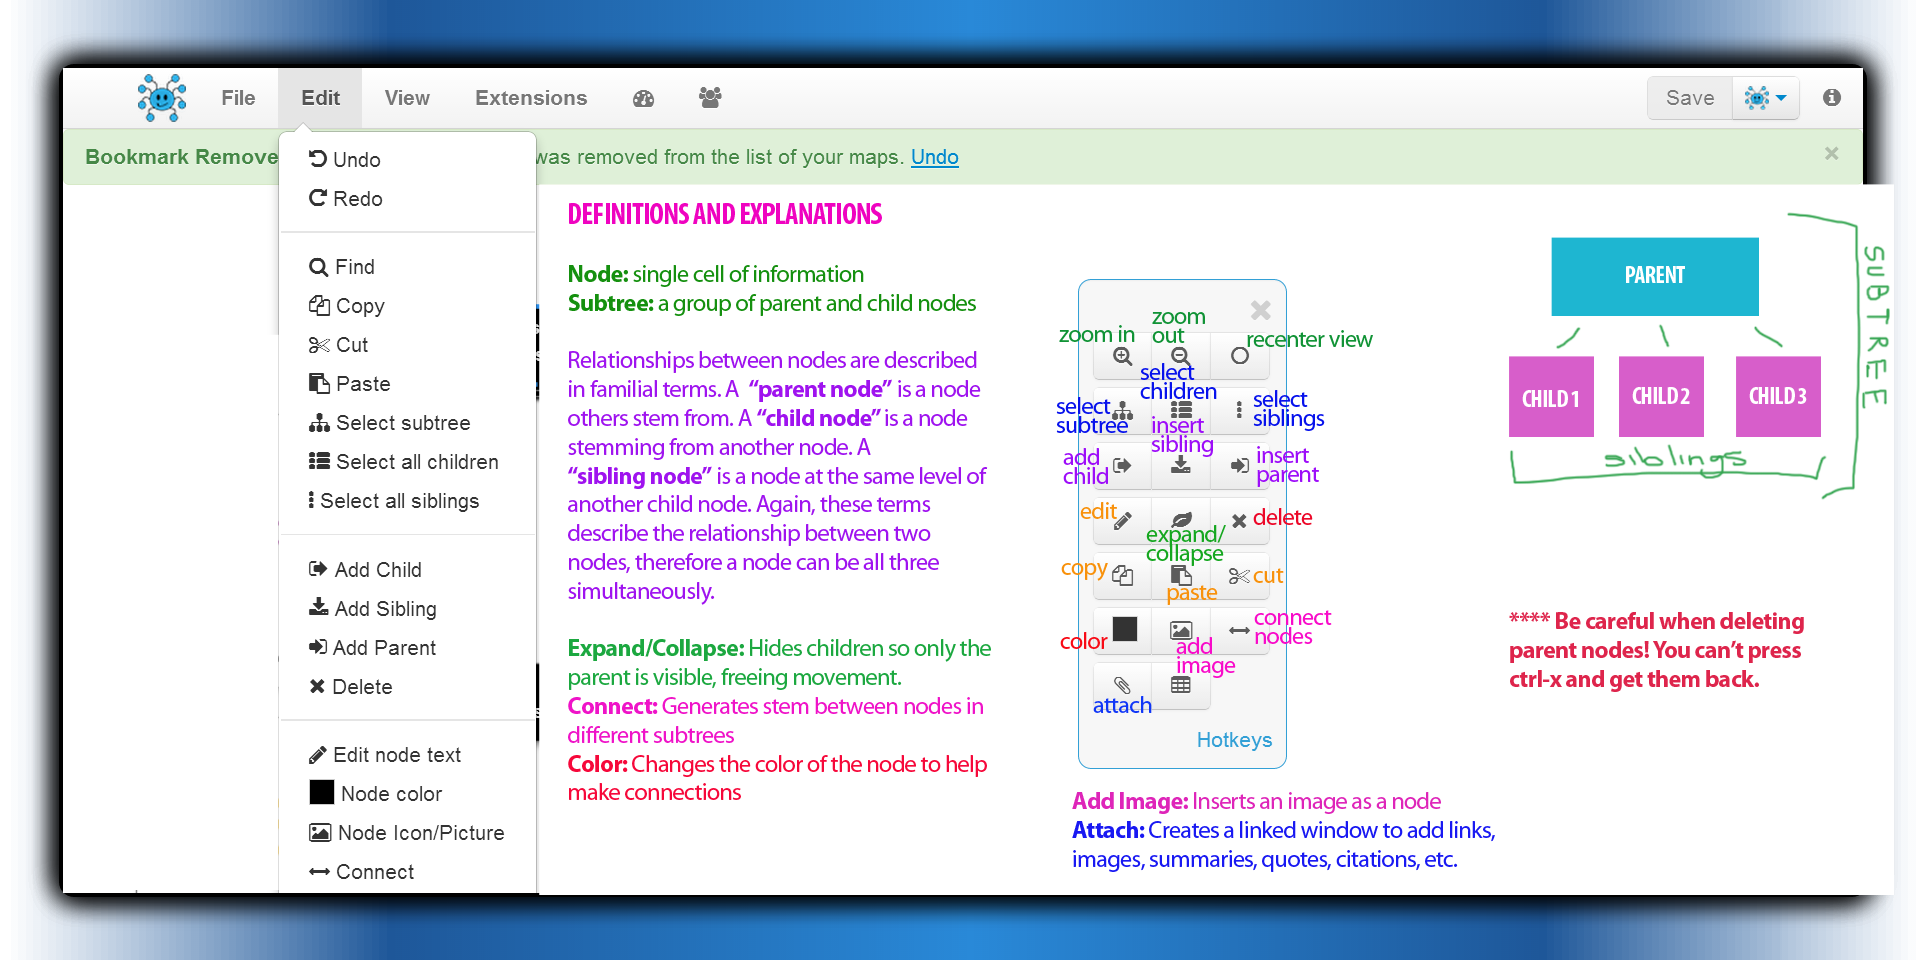
Provided below is an explanatory screenshot of your MindMup workspace and a 4-minute MindMup basics tutorial. It might be good to play with the program on your own for 10 minutes or so to get the hang of it. [/cs_text][x_image type=”none” src=”https://www.dwrl.utexas.edu/wp-content/uploads/2016/10/Screenshot4-e1478023708138.png” alt=”” link=”true” href=”https://www.dwrl.utexas.edu/wp-content/uploads/2016/10/Screenshot4-e1478023708138.png” title=”” target=”” info=”none” info_place=”top” info_trigger=”hover” info_content=””][cs_text class=”cs-ta-center”]Larger View[/cs_text][x_video_player type=”16:9″ src=”https://www.youtube.com/watch?v=–v7ZfTHNJ8″ hide_controls=”false” autoplay=”false” no_container=”false” preload=”none” advanced_controls=”false” muted=”false” loop=”false” poster=””][cs_text]STEP 1: Identify data set, drop everything in. First, create a new mind map and save it to your Google Drive or wherever you’re going to save it. Next, make a parent node naming your data set i.e. “Needs/Wants of Mac vs. PC Users.” Next, you’re going to turn all the specific pieces of information you’ve gathered into child nodes. Don’t worry about where things are. Just get everything onto the page. Remember, MindMup has that awesome attachment feature, so you can/should include links, citations, excerpts, abstracts, images, charts, graphs, etc., which makes things REALLY easy when you go to write your paper because everything is in one place. You can also use images as nodes if your data set includes photos. This stage can take as long as you want. If I was gathering sources for a lit review, for example, I might drop in two articles a day for a few weeks. Or you can put everything in at once. Note: The video example only has 21 sources for expediency’s sake, but you can apply these same principles and methods to virtually any data set.[/cs_text][x_gap size=”30px”][cs_text]STEP 2: Start identifying some characteristics of your data by creating child nodes for each piece. Again, you can do this as you go or you can do it all at once. In the example video below, I know I’m roughly going to be talking about “offensive” themes in the 21 Most Banned/Challenged Books, so I start naming objections people have to each work. [/cs_text][x_video_player type=”16:9″ src=”https://youtu.be/_PH9qldMAfs” hide_controls=”false” autoplay=”false” no_container=”false” preload=”none” advanced_controls=”false” muted=”false” loop=”false” poster=””][cs_text]STEP 3: Begin making connections. This is the fun part. You’ve probably already noticed themes emerging. Start color coding for them and see what happens! This can start to get tricky because many connections will overlap and many different pieces will connect in many different ways. Remember, you can move things around and add at will in MindMup. Also remember, this is your tool. It doesn’t have to make sense to anyone but you. [/cs_text][x_video_player type=”16:9″ src=”https://youtu.be/wAxAclm3frM” hide_controls=”false” autoplay=”false” no_container=”false” preload=”none” advanced_controls=”false” muted=”false” loop=”false” poster=””][cs_text]STEP 4: Identify themes and clusters. Look at your map and see what appears again and again. These broad patterns should become your themes. Create nodes to express these themes and move your subtrees around until they’re where you want them. Use the connect tool to link different pieces even more concretely. Again, this part can get tricky. You might have to create sub-themes. You might realize two themes are really two manifestations of the same theme just experienced or written about differently. You might realize there’s a fundamental difference between some pieces and others. You might realize some things don’t quite belong anywhere. All of this is okay! We’re working our way through complex information, letting the data determine the main idea rather than the main idea determining the data. This is big stuff.[/cs_text][x_video_player type=”16:9″ src=”https://youtu.be/VQG5awSZalU” hide_controls=”false” autoplay=”false” no_container=”false” preload=”none” advanced_controls=”false” muted=”false” loop=”false” poster=””][cs_text]STEP 5: Start asking questions. You really have two options here. Depending on your purpose, you can do either one. If your whole point was to determine commonalities between disparate data (like things Apple vs. PC users have in common). You can stop here and make the argument: “Based on surveys of 100 Mac users and 100 PC users, customers value these three traits the most.” Or you can use this as a place to move forward to ask more specific questions. Based on my MindMup creation above, for example, I may want to explore: things female authors are talking about vs. things male authors are talking about; connections between race, women, and consent; how many of these fears have to do with challenging Christianity and Christian values; why do we hate things our bodies do naturally so much; why are parents so terrified about teenagers having sex. Just to name a few. Of course, questions mean more research and you might have seek out many more sources to understand or make an argument about anything. Fortunately, mind mapping can help with that too. [/cs_text][x_gap size=”30px”][/cs_column][/cs_row][/cs_section][cs_section bg_color=”rgb(225, 229, 234)” parallax=”false” style=”margin: 0px 0px 0px 60px;padding: 10px 0px;”][cs_row inner_container=”true” marginless_columns=”false” style=”margin: 0px auto;padding: 0px;”][cs_column fade=”false” fade_animation=”in” fade_animation_offset=”45px” fade_duration=”750″ type=”1/1″ style=”padding: 0px;”][x_feature_headline level=”h2″ looks_like=”h3″ icon=”paperclip”]Assessment Suggestions[/x_feature_headline][x_gap size=”30px”][cs_text]This lesson plan does not include traditional assessment. However, here are a few ideas if you want to determine students’ level of engagement with these processes:
[/cs_text][cs_icon_list][cs_icon_list_item title=”ask them to write a short narrative about their mindmapping experience and thinking along the way” type=”lightbulb-o” link_enabled=”false” link_url=”#” link_new_tab=”false”]ask them to write a short narrative about their mindmapping experience and thinking along the way[/cs_icon_list_item][cs_icon_list_item title=”split students into teams to compare the potentially very different mindmaps they’ve produced and discuss these differences as a class” type=”lightbulb-o” link_enabled=”false” link_url=”#” link_new_tab=”false”]split students into teams to compare the potentially very different mindmaps they’ve produced and discuss these differences as a class[/cs_icon_list_item][cs_icon_list_item title=”have them export a PDF or JPEG of their mindmap and describe their thinking about connections and patterns by inserting comments” type=”lightbulb-o” link_enabled=”false” link_url=”#” link_new_tab=”false”]have them export a PDF or JPEG of their mindmap and describe their thinking about connections and patterns by inserting comments[/cs_icon_list_item][/cs_icon_list][cs_text]Remember, this workshop is about giving people useful tools and useful possibilities for thinking and using visuals as a way to manage complex, critical thinking. This method works for some people and might not for others. It’s all about how things make sense to you.
[/cs_text][/cs_column][/cs_row][/cs_section][/cs_content]

