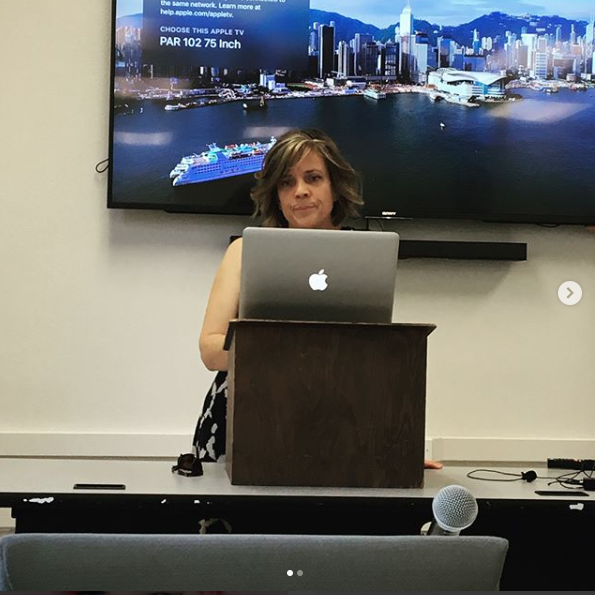
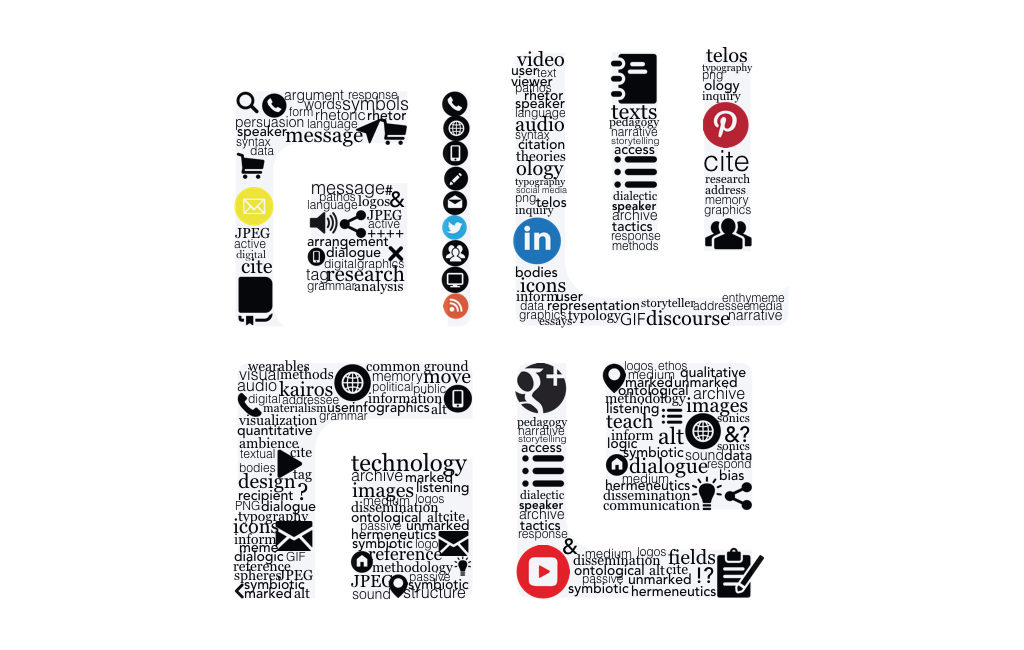
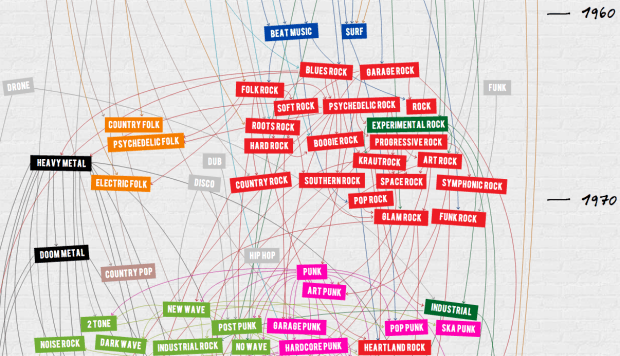
On November 17, the DWRL hosted a guest lecture and Q &A with Dr. Linda Walsh. Dr. Walsh is an associate professor of English at the University of Nevada, Reno. Her research focuses on rhetoric of science, topologies, visual rhetoric, and reception studies with specific attention to the ethos, or...
Lesson Plan: Visualizing The News As A Timeline
In today’s information economy, the abundance and production pace of information can make it difficult to follow news coverage of any given topic or event. Whether you are comparing different coverage of the same topic by more than one news source, tracking coverage of a topic in a single source...
Lesson Plan: Making Documents Accessible for Screen Reader Software
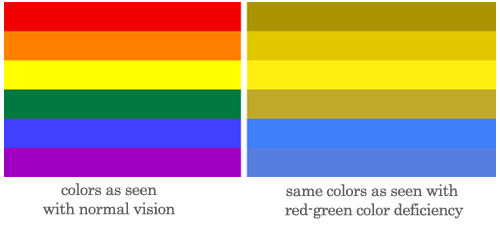
In an earlier blog post, the DWRL offered various free resources and tips for creating visual content that is accessible to people with visual impairments. For example, The WAVE Web Accessibility Evaluation Tool helps pinpoint errors on a webpage interface that may be difficult for screen readers -- software that...
Accessible Data Visualizations
Are you reading this blog post from computer screen or an screen reader? Did you need to adjust the font or text size, screen brightness, or filter the interface through a browser extension or rely on an app like Accessibility to access this information? In her entry on "Access" in Keywords...
When Data Visualization Goes Wrong and Numbers Mislead
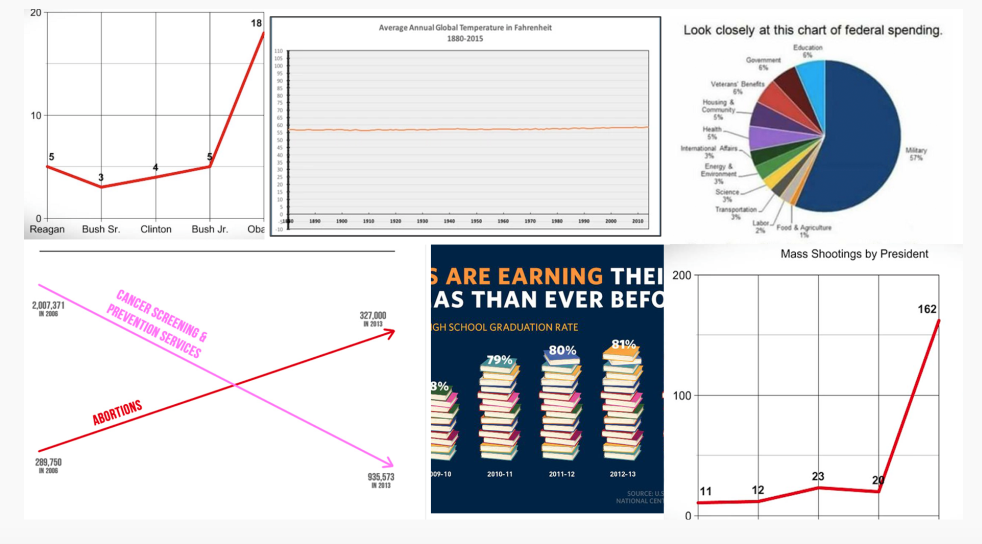
Source image: The Most Misleading Charts of 2015 Fixed on Quartz To some students and readers, one of the rhetorical effects of data visualization is that the mere presence of a pie chart, graph, or timeline on a page confers “legitimacy” to an argument. At worse, this gesture attempts to...
Data Visualization: Visualizing Sound Texts
In an upcoming lesson plan, I introduce some ways in which visualization be used to analyze elements of a literary text such as genre, theme, motifs, or plot structure. However, that lesson plan focuses predominantly on visual works. What are some of the ways in which visualization could...
Lesson Plan: Visualizing and Analyzing Texts with Voyant
[cs_content][cs_section parallax="false" separator_top_type="none" separator_top_height="50px" separator_top_angle_point="50" separator_bottom_type="none" separator_bottom_height="50px" separator_bottom_angle_point="50" style="margin: 0px;padding: 50px 0px 10px;"][cs_row inner_container="true" marginless_columns="false" style="margin: 0px auto;padding: 0px;"][cs_column fade="false" fade_animation="in" fade_animation_offset="45px" fade_duration="750" type="1/1" style="padding: 0px;"][x_image type="none" src="http://www.dwrl.utexas.edu/wp-content/uploads/2016/11/Screen-Shot-2016-11-08-at-2.00.47-PM.png" alt="screen shot of Voyant interface performing multiple text analysis tasks" link="false" href="#" title="" target="" info="none" info_place="top" info_trigger="hover" info_content=""][/cs_column][/cs_row][/cs_section][cs_section bg_color="hsl(0, 0%, 100%)" parallax="false"...
Archiving in the Age of Writing Productivity
The Digital Archiving team is currently working on the creation of an app that aims to explore what rethinking the “archive” would mean for pedagogy and writing. One implication of rethinking "archiving" and "writing" might be that writing in digital media is always already a process of archiving. How might...


