A DWRL Practicum Online Module by Abby Burns. As a hard-of-hearing instructor who struggles intermittently with listening fatigue, there are days when keeping up with class discussion eats away at all of my energy (or requires more energy than I have), diminishing my capacity to respond in real time. One...
Lesson Plan: Analyzing and (Re)Performing Vocality

As rhetoric and composition instructors, we typically have students work with written texts, both in analysis and in production. While we might ask students to answer questions about tone and prosody in written texts, often their analyses remained confined to stylistic concerns without attending to questions of delivery. What gets...
Lesson Plan: Visualizing The News As A Timeline
In today’s information economy, the abundance and production pace of information can make it difficult to follow news coverage of any given topic or event. Whether you are comparing different coverage of the same topic by more than one news source, tracking coverage of a topic in a single source...
Accessible Data Visualizations
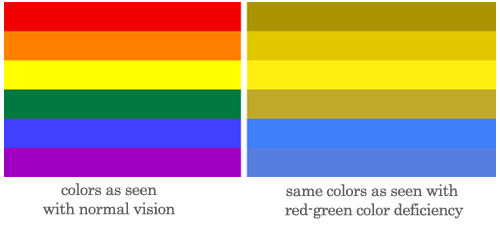
Are you reading this blog post from computer screen or an screen reader? Did you need to adjust the font or text size, screen brightness, or filter the interface through a browser extension or rely on an app like Accessibility to access this information? In her entry on "Access" in Keywords...
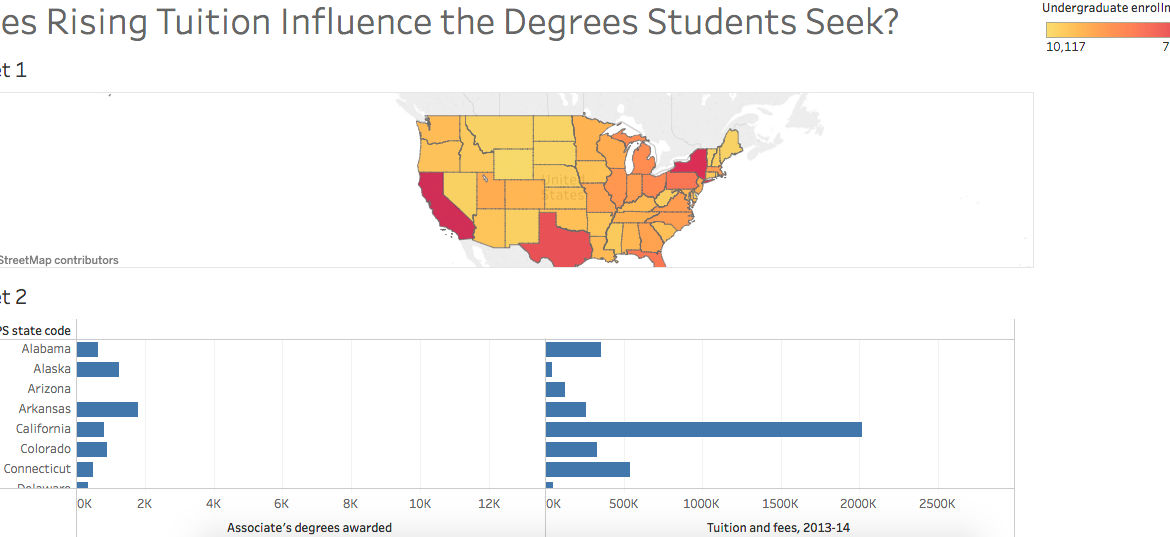
Lesson Plan: Visualizing Difference with Tableau Public
In his much referenced TED Talk, David McCandless says that “if you start working with [data] and playing with it in a certain way, interesting things can appear and different patterns can be revealed” (5:57-6:14). And Virginia Kuhn argues that there are “two main uses for information visualization: discovery and...
Lesson Plan: Advanced Piktochart

[cs_content][cs_section parallax="false" separator_top_type="none" separator_top_height="50px" separator_top_angle_point="50" separator_bottom_type="none" separator_bottom_height="50px" separator_bottom_angle_point="50" _order="0" style="margin: 0px;padding: 50px 0px 10px;"][cs_row inner_container="true" marginless_columns="false" style="margin: 0px auto;padding: 0px;"][cs_column fade="false" fade_animation="in" fade_animation_offset="45px" fade_duration="750" type="1/1" style="padding: 0px;"][x_image type="none" src="http://www.dwrl.utexas.edu/wp-content/uploads/2017/11/giphy.gif" alt="" link="false" href="#" title="" target="" info="none" info_place="top" info_trigger="hover" info_content=""][/cs_column][/cs_row][/cs_section][cs_section bg_color="hsl(0, 0%, 100%)" parallax="false" separator_top_type="none" separator_top_height="50px" separator_top_angle_point="50" separator_bottom_type="none" separator_bottom_height="50px" separator_bottom_angle_point="50" class="cs-ta-left" style="margin:...
(Re)visualizing Data

Team Data Visualization is proud to present a new set of lesson plans that we've designed to be as cohesive as the first. With a little planning, anyone can share a data visualization lesson plan with their students. Sarah Welsh and Sierra Mendez collaborated on two lesson plans. The first takes inspiration from...
Cool Tools: Tableau
Last Friday, the DWRL hosted another workshop in preparation for the digitally accessible map we plan to create for our diverse student body. In conjunction with a discussion of collecting and analyzing data, Amy Tuttle provided an excellent lesson on Tableau, an online service that allows users to re-present data...
Adobe Creatives: What’s the Difference?
[cs_content][cs_section parallax="false" style="margin: 0px;padding: 45px 0px;"][cs_row inner_container="true" marginless_columns="false" style="margin: 0px auto;padding: 0px;"][cs_column fade="false" fade_animation="in" fade_animation_offset="45px" fade_duration="750" type="1/1" style="padding: 0px;"][x_image type="none" src="http://www.dwrl.utexas.edu/wp-content/uploads/2016/10/logos.001.jpeg" alt="" link="false" href="#" title="" target="" info="none" info_place="top" info_trigger="hover" info_content=""][/cs_column][/cs_row][/cs_section][cs_section bg_color="hsl(0, 0%, 100%)" parallax="false" class="cs-ta-left" style="margin: 0px;padding: 45px 0px 0px;"][cs_row inner_container="true" marginless_columns="false" style="margin: 0px auto;padding: 0px;"][cs_column fade="false" fade_animation="in" fade_animation_offset="45px" fade_duration="750"...
Cool Tools: Sound Mapping
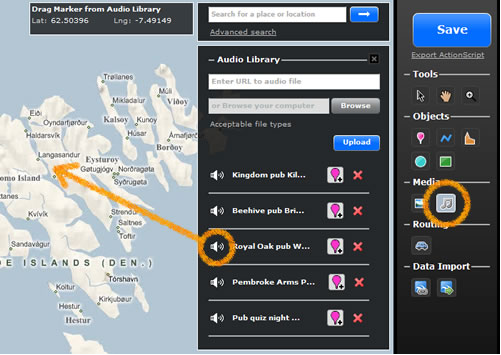
[cs_content][cs_section parallax="false" style="margin: 0px;padding: 45px 0px;"][cs_row inner_container="true" marginless_columns="false" style="margin: 0px auto;padding: 0px;"][cs_column fade="false" fade_animation="in" fade_animation_offset="45px" fade_duration="750" type="1/1" style="padding: 0px;"][cs_text]Jazz began in New Orleans at the turn of the century and spread like wildfire in the 1920s, as men and women who perfected the genre booked gigs in Austin, Chicago, and...