
One of my favorite data visualizations concerns the Beatles. Created by Adam McCann from Dueling Data, the graphic, amongst other things, lets the user hover their computer cursor over illustrations of band members to see how many hit songs those members have written and when. I find the visualization memorable,...
Adobe Creatives: What’s the Difference?
[cs_content][cs_section parallax="false" style="margin: 0px;padding: 45px 0px;"][cs_row inner_container="true" marginless_columns="false" style="margin: 0px auto;padding: 0px;"][cs_column fade="false" fade_animation="in" fade_animation_offset="45px" fade_duration="750" type="1/1" style="padding: 0px;"][x_image type="none" src="http://www.dwrl.utexas.edu/wp-content/uploads/2016/10/logos.001.jpeg" alt="" link="false" href="#" title="" target="" info="none" info_place="top" info_trigger="hover" info_content=""][/cs_column][/cs_row][/cs_section][cs_section bg_color="hsl(0, 0%, 100%)" parallax="false" class="cs-ta-left" style="margin: 0px;padding: 45px 0px 0px;"][cs_row inner_container="true" marginless_columns="false" style="margin: 0px auto;padding: 0px;"][cs_column fade="false" fade_animation="in" fade_animation_offset="45px" fade_duration="750"...
Teaching Data Visualization: An Introduction
[cs_content][cs_section parallax="false" style="margin: 0px;padding: 45px 0px;"][cs_row inner_container="true" marginless_columns="false" style="margin: 0px auto;padding: 0px;"][cs_column fade="false" fade_animation="in" fade_animation_offset="45px" fade_duration="750" type="1/1" style="padding: 0px;"][cs_text]Team Data Visualization is proud to present a set of lesson plans that are ready to use in your classroom (networked or not). Whether you’ve been thinking about introducing a data visualization...
Lesson Plan: Navigating Research with Mind Maps
[cs_content][cs_section parallax="false" style="margin: 0px;padding: 50px 0px 10px;"][cs_row inner_container="true" marginless_columns="false" style="margin: 0px auto;padding: 0px;"][cs_column fade="false" fade_animation="in" fade_animation_offset="45px" fade_duration="750" type="1/1" style="padding: 0px;"][x_image type="none" src="http://www.dwrl.utexas.edu/wp-content/uploads/2016/10/Mindmup4m.png" alt="A MindMup screenshot in which clusters of ideas are color-coded to demonstrate similar themes" link="false" href="#" title="" target="" info="none" info_place="top" info_trigger="hover" info_content=""][/cs_column][/cs_row][/cs_section][cs_section bg_color="hsl(0, 0%, 100%)" parallax="false" class="cs-ta-left" style="margin:...
Lesson Plan: Visual Literacy and Infographic (Re)Composition
[cs_content][cs_section parallax="false" separator_top_type="none" separator_top_height="50px" separator_top_angle_point="50" separator_bottom_type="none" separator_bottom_height="50px" separator_bottom_angle_point="50" style="margin: 0px;padding: 50px 0px 10px;"][cs_row inner_container="true" marginless_columns="false" style="margin: 0px auto;padding: 0px;"][cs_column fade="false" fade_animation="in" fade_animation_offset="45px" fade_duration="750" type="1/1" style="padding: 0px;"][x_image type="none" src="http://www.dwrl.utexas.edu/wp-content/uploads/2016/10/apple-on-desk.jpg" alt="""" link="false" href="#" title="" target="" info="none" info_place="top" info_trigger="hover" info_content=""][/cs_column][/cs_row][/cs_section][cs_section bg_color="hsl(0, 0%, 100%)" parallax="false" separator_top_type="none" separator_top_height="50px" separator_top_angle_point="50" separator_bottom_type="none" separator_bottom_height="50px" separator_bottom_angle_point="50" class="cs-ta-left" style="margin: 0px;padding:...
Lesson Plan: Data Collection and Database Rhetorics
[cs_content][cs_section parallax="false" style="margin: 0px;padding: 50px 0px 10px;"][cs_row inner_container="true" marginless_columns="false" style="margin: 0px auto;padding: 0px;"][cs_column fade="false" fade_animation="in" fade_animation_offset="45px" fade_duration="750" type="1/1" style="padding: 0px;"][x_image type="none" src="http://www.dwrl.utexas.edu/wp-content/uploads/2016/10/12210424505_2da556e2df_z.jpg" alt="A mystery scatter plot demonstrating how data doesn't make sense without context; a large number of colored dots arranged in vertical lines, with no axes, key or labels"...
Cool Tools: Sound Mapping
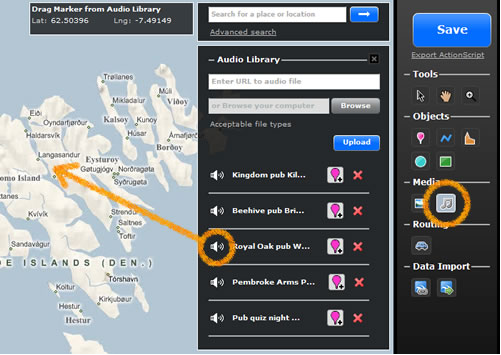
[cs_content][cs_section parallax="false" style="margin: 0px;padding: 45px 0px;"][cs_row inner_container="true" marginless_columns="false" style="margin: 0px auto;padding: 0px;"][cs_column fade="false" fade_animation="in" fade_animation_offset="45px" fade_duration="750" type="1/1" style="padding: 0px;"][cs_text]Jazz began in New Orleans at the turn of the century and spread like wildfire in the 1920s, as men and women who perfected the genre booked gigs in Austin, Chicago, and...
Cool Tools: Piktochart
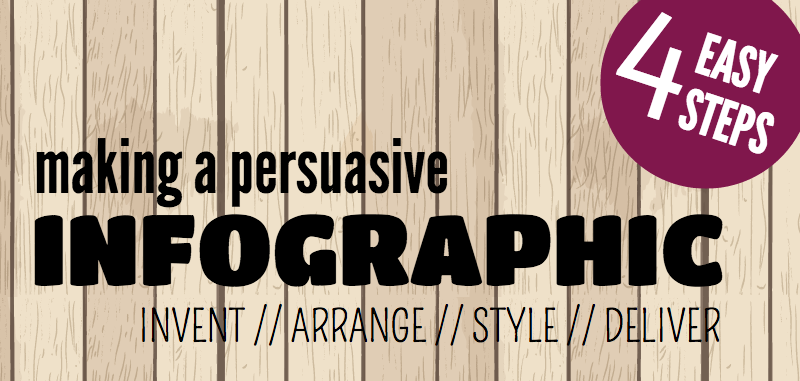
Have you thought about incorporating infographics into your classroom? Here at UT, the first year writing curriculum now includes an infographic assignment in which students are asked to remix their final persuasive essay into a visual form. The Digital Writing & Research Lab has been collaborating with the Department of...
The New View-Master Takes on Augmented Reality; Should We Take it Into the Classroom?
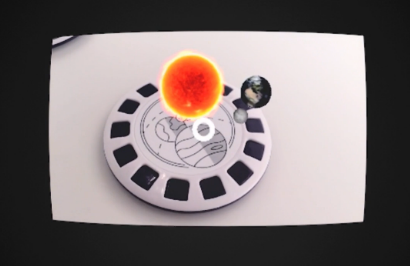
We are, as others have pointed out, in the age of augmented reality. Whereas the twentieth century saw virtual reality develop in leaps and bounds, it is augmented reality that reigns supreme in the 2000s. Case in point: the View-Master. (more…)
Digital Pedagogy Showcase: Google Tours in the Writing Classroom
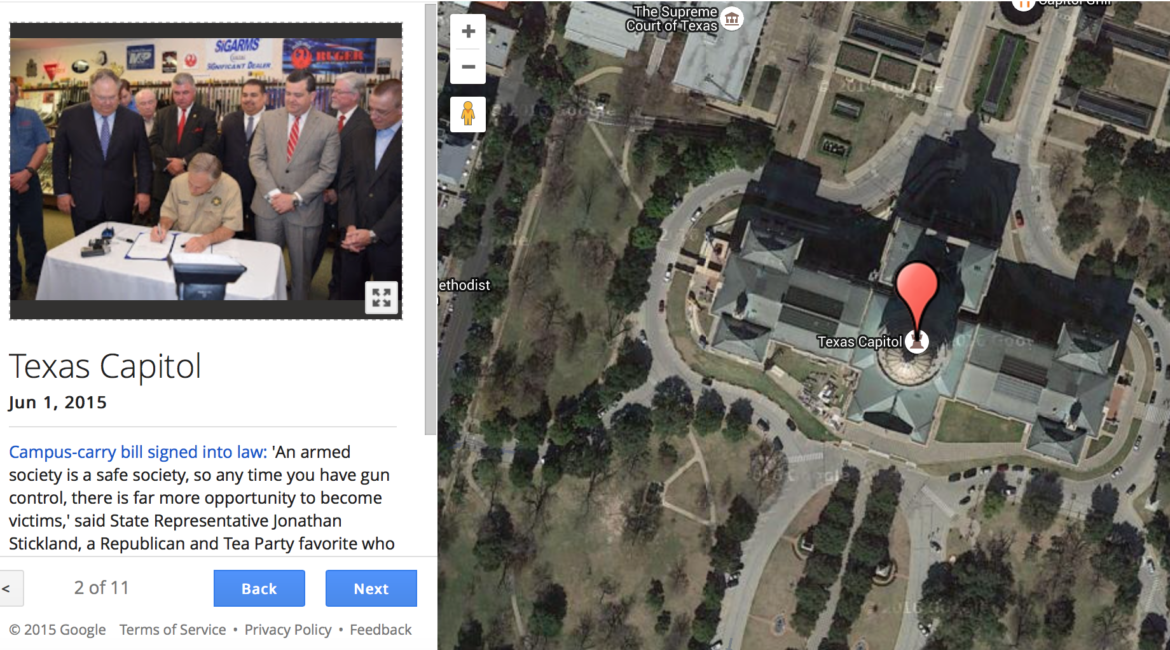
At the DWRL's 2016 Spring Digital Pedagogy Showcase, the Augmented Reality Research Group showed attendees how to design assignments and lesson plans using Google Tours. (more…)